The Moya Bands ThresholdIndicator, grounded in the seminal contributions of Kalman and Bucy (1961) and refined through the meticulous research of Talordphop, Sukparungsee, and Areepong (2022), establishes itself as a cutting-edge trading tool. It ingeniously combines the predictive precision of the Kalman Filter with the dynamic adaptability of the Modified Exponentially Weighted Moving Average (MEWMA) and the strategic volatility analysis provided by the Average True Range (ATR) bands. This innovative integration not only deciphers the complexities of market dynamics but also redefines technical analysis by offering advanced weight recalibration based on both historical and contemporary data, far surpassing traditional EWMA charts.
The ATR bands, calculated in harmony with the MEWMA, bring a crucial dimension to the analysis, accurately marking areas of potential volatility and signalling critical points for tactical actions. These are essential components in risk assessment and strategic planning. Furthermore, the indicator is endowed with advanced capabilities for generating trading signals, enabling users to configure overbought and oversold levels and receive real-time notifications through integration with Telegram. This ensures that no significant market opportunities are missed. This synergistic approach, which combines the precision of the Kalman Filter, the rapid adaptability of the MEWMA, and the in-depth volatility analysis of the ATR bands, makes the Moya Bands Threshold an unparalleled resource. It provides a comprehensive and multifaceted perspective on market trends, volatility, and emerging trading opportunities.
Indicator Components
- Kalman Filter and MEWMA: These components are used to filter market noise and smooth the price series, resulting in a cleaner line that represents the central trend of the prices.
- ATR Bands: Calculated using the ATR, these bands help visualize market volatility. An upper and lower band are calculated around the smoothed moving average, providing dynamic levels of support and resistance.
- Percentage Bands: Set around the moving average, these bands are a fixed percentage above and below the moving average, offering insight into how far the current prices are from the moving average.
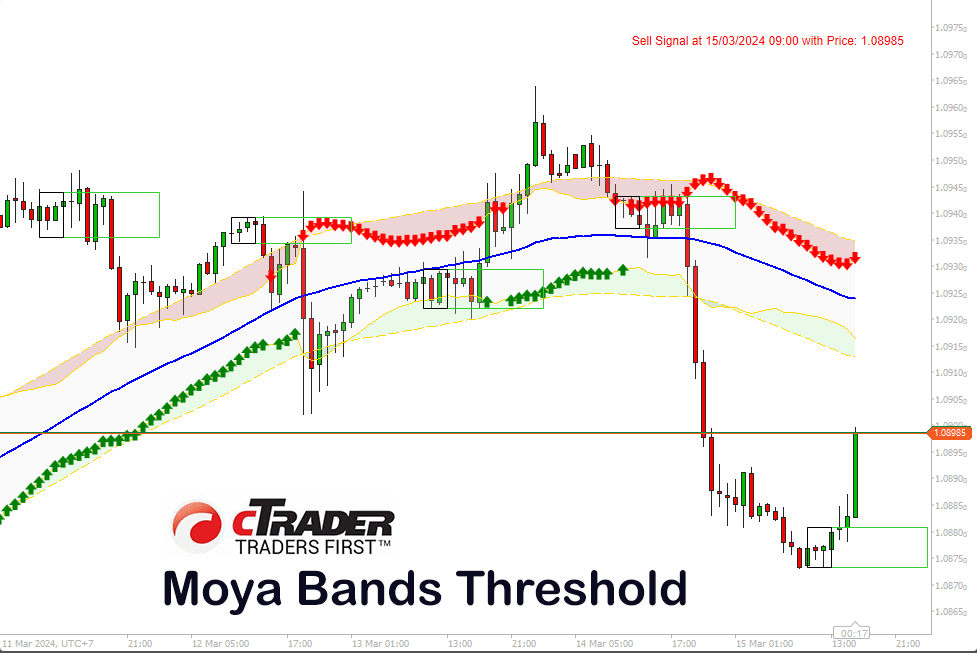
- Trading Signals: The indicator can generate buy or sell signals based on the current price's position relative to the ATR and percentage bands.
Interpretation
- Central Trend: The main line of the indicator (MEWMA Kalman Filter) shows the central trend of prices. Significant upward or downward movements in this line may indicate an uptrend or downtrend, respectively.
- Volatility: The ATR bands adjust according to market volatility. An increase in the distance between the bands may indicate higher volatility, while a decrease suggests lower volatility.
- Support and Resistance Levels: The ATR and percentage bands act as dynamic levels of support and resistance. A price moving above the upper bands may indicate a potential bullish move, while a price dropping below the lower bands may suggest a bearish move.
- Buy and Sell Signals:
- Buy: A buy signal is generated when the price crosses and closes above the lower ATR band or percentage band, potentially indicating the start of an uptrend.
- Sell: A sell signal occurs when the price crosses and closes below the upper ATR band or percentage band, possibly signaling the beginning of a downtrend.
- Telegram Notifications: If configured, Telegram notifications can alert the user to significant changes or signals generated by the indicator, allowing for quick decision-making.
Example of Trading Use
A trader might use this indicator to identify optimal entry and exit points based on the interpretation of buy and sell signals and changes in volatility indicated by the ATR bands. For example, entering a long position after a buy signal and considering taking profits or entering a short position when a sell signal is received.
Conclusion
This indicator provides a sophisticated tool for traders looking to filter market noise and gain a clearer view of trends and volatility. As with any indicator, it's advisable to use it as part of a broader trading strategy and confirm signals with other indicators or technical analysis.
How To Install & Remove
First, make sure you have the cTrader trading platform installed, unzip the file and double-click on it to automatically install it onto the platform. The file that is installed can be found in your indicators folder.
Any Questions?
If you have any questions, please first search our product help forum for the answer, if you cannot find it, post a new question.
Need a Broker
If you are still looking for a broker you can trust, take a look at our best cTrader broker site.

